


Z-Score to Percentile Calculator
Turn a z-score into a rank you can say out loud. Enter a z-score, or a raw score with its mean and standard deviation, and see how much of the group falls below it. Or start from a percentile and get the z-score and score behind it.
Z-Score and Percentile Converter
Pick what you have. The answer updates as you type.
Working appears here.Syntax appears here.Summary appears here.Every answer comes with a sentence you can quote, such as “higher than about 89% of the group”.
Go from a z-score or a raw score to a percentile, or from a percentile back to the z-score and the score.
The exact normal CDF is used, so far-tail values stay right. Every output is checked against SciPy.
What Does Converting a Z-Score to a Percentile Tell You?
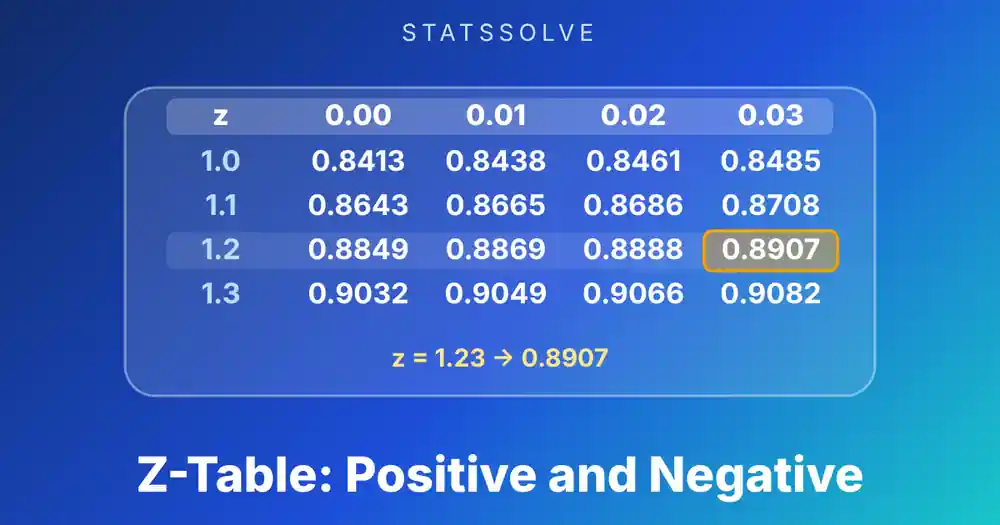
It tells you how much of the group sits below a value. A z-score of 1.23 converts to the 89.07th percentile, which means about 89% of a normal population scores lower and about 11% scores higher. The z-score says how far from the average a value is, and the percentile turns that distance into a rank.
Most people meet the idea through test results. A report card that says “z = 1.5” means little to a parent, while “higher than 93% of students” is clear at once. The same conversion works for heights, blood-pressure readings, delivery times or any measurement that follows a bell curve.
The calculator above does the conversion in three directions: from a z-score, from a raw score with its mean and standard deviation, and back from a percentile to the z-score and score behind it. If you want to see the numbers laid out as a printed grid instead, the z-table shows the same areas for every z-score from −3.9 to 3.9.
How Do You Use This Z-Score to Percentile Calculator?
Choose what you have, type it in, and the percentile appears as you type.
- A z-score. Enter any value such as 1.23 or −0.8. You get the percentile, the share above, the middle share within ±|z|, and a one-line reading in plain words.
- A raw score. Enter the score, the mean and the standard deviation. The page first works out z = (x − mean) / SD, then converts it.
- A percentile. Enter 90 or 90%. You get the z-score with that much of the curve below it. Add a mean and standard deviation and you also get the score that sits at that percentile.
Pick the number of decimal places that suits your report. Two decimals is typical for a score report, four matches a z-table, and six is useful when you compare against software output. The rounding only affects what is displayed, never the calculation.
Percentages, decimals and fractions are accepted for percentiles, so 95, 95% and 0.95 all mean the 95th percentile. The standard deviation must be positive, and it is the standard deviation, not the variance.
How Do You Convert a Z-Score to a Percentile?
Find the area under the standard normal curve to the left of the z-score and multiply it by 100. That area is the cumulative probability Φ(z), and 100 × Φ(z) is the percentile.
Take z = 1.23. A z-table gives Φ(1.23) = 0.8907 in row 1.2, column 0.03, so the percentile is 89.07. The unrounded value is 89.0651, which is why a calculator and a printed table can differ in the last digit.
For the share above a score, subtract the percentile from 100. A z-score of 1.23 has 100 − 89.07 = 10.93% of the group above it, so it falls in the top 11%. That is the number to quote when someone asks how rare a result is, and the calculator shows it as “Percent above” next to every percentile.
Negative z-scores work the same way and land below 50. For z = −1.2 the area to the left is 0.1151, so the percentile is 11.51. Symmetry gives a quick check: the percentile for −z and for z always add up to 100, as 11.51 and 88.49 do for z = ±1.2.
How Do You Convert a Raw Score to a Percentile?
Standardise the score first, then convert. The z-score is the score minus the mean, divided by the standard deviation.
Suppose an exam has a mean of 72 and a standard deviation of 8, and you scored 85. Then z = (85 − 72) / 8 = 1.625, and Φ(1.625) = 0.9479. Your score is at the 94.79th percentile, so you did better than about 95 out of every 100 test takers.
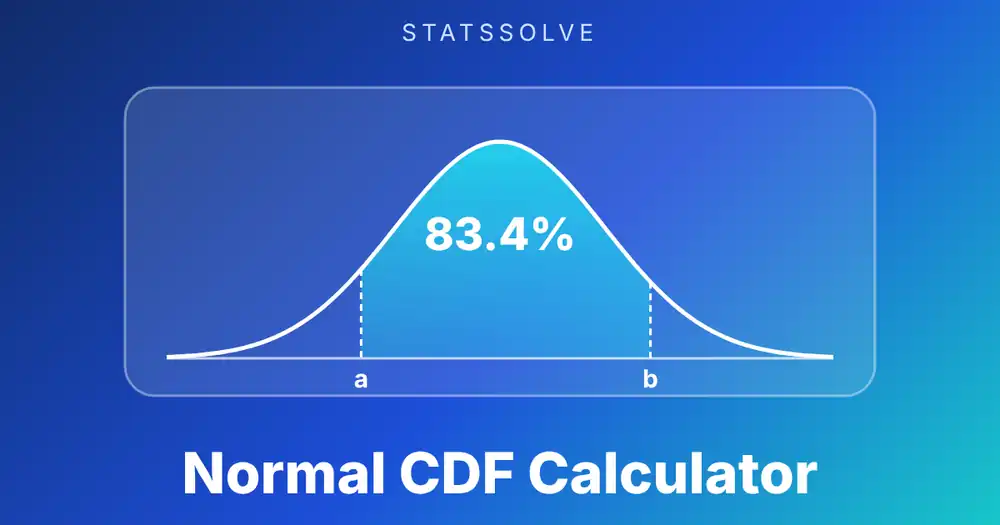
If you only have raw data and want the standard deviation first, use the standard deviation calculator. For a score and a distribution that are already given, the normal CDF calculator returns the same percentile in one step with any mean and standard deviation.
How Do You Convert a Percentile Back to a Z-Score?
Run the conversion backwards. Divide the percentile by 100 to get a left-tail area, then find the z-score with that area to its left. This is the inverse of the normal CDF, also called the quantile function.
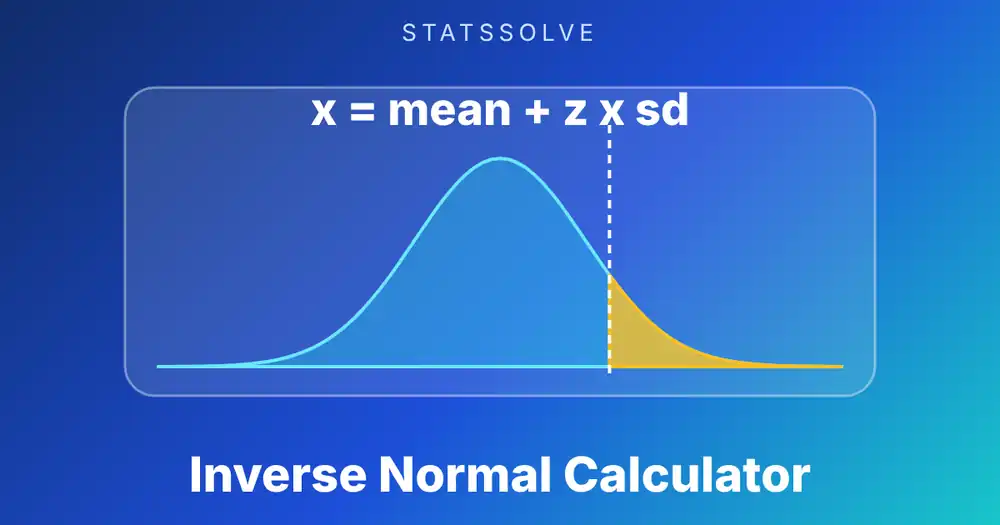
For the 90th percentile the area is 0.90 and the z-score is 1.2816. To turn it into a score, use x = mean + z × SD. With a mean of 100 and a standard deviation of 15, the 95th percentile is 100 + 1.6449 × 15 = 124.67. The inverse normal distribution calculator handles right-tail, middle and two-tail areas as well, if your question is phrased that way.
| Percentile | z-score | Percentile | z-score |
|---|---|---|---|
| 1st | −2.3263 | 75th | 0.6745 |
| 5th | −1.6449 | 90th | 1.2816 |
| 10th | −1.2816 | 95th | 1.6449 |
| 25th | −0.6745 | 97.5th | 1.9600 |
| 50th | 0.0000 | 99th | 2.3263 |
What Is the Z-Score to Percentile Chart?
Here is the conversion for whole and half z-scores, which covers most everyday questions. Each percentile is 100 × Φ(z).
| z-score | Percentile | z-score | Percentile |
|---|---|---|---|
| −3 | 0.13 | 0.5 | 69.15 |
| −2.5 | 0.62 | 1 | 84.13 |
| −2 | 2.28 | 1.5 | 93.32 |
| −1.5 | 6.68 | 2 | 97.72 |
| −1 | 15.87 | 2.5 | 99.38 |
| −0.5 | 30.85 | 3 | 99.87 |
| 0 | 50.00 | 3.5 | 99.98 |
Notice how slowly the top of the scale fills in. Going from z = 2 to z = 3 only moves the percentile from 97.72 to 99.87, because almost everyone is already below. A z-score of 1 is the 84th percentile and a z-score of −1 is the 16th.
Worked Example 1: Where Do IQ Scores of 130 and 85 Fall?
IQ scores are scaled to a mean of 100 and a standard deviation of 15, so the conversion is direct.
IQ 130. z = (130 − 100) / 15 = 2.00. Φ(2) = 0.9772, so the score is at the 97.72nd percentile. About 2.3% of people score higher.
IQ 85. z = (85 − 100) / 15 = −1.00. Φ(−1) = 0.1587, so the score is at the 15.87th percentile. About 84% of people score higher.
The two scores sit exactly one and two standard deviations from the mean, so they land on the familiar landmarks of the empirical rule. Between 85 and 115 lies 68.27% of the population, and between 70 and 130 lies 95.45%.
Worked Example 2: Which Exam Score Is Stronger?
Z-scores let you compare scores from different tests. Student A scores 82 on an exam with a mean of 70 and a standard deviation of 6. Student B scores 90 on an exam with a mean of 80 and a standard deviation of 10.
Step 1. A: z = (82 − 70) / 6 = 2.00. B: z = (90 − 80) / 10 = 1.00.
Step 2. A is at the 97.72nd percentile and B is at the 84.13th.
Student A did better relative to their own class even though 82 is a lower number than 90. The percentile makes that visible, which is why standardised results are reported this way. The same logic is behind the normal curve calculator, where you can plot both scores on one bell curve.
Worked Example 3: What Score Is the 95th Percentile?
A test has a mean of 100 and a standard deviation of 15. What score marks the 95th percentile, and the 99th?
Step 1. The 95th percentile is the area 0.95, and the z-score for that area is 1.6449.
Step 2. Convert back to the score scale: x = 100 + 1.6449 × 15 = 124.67.
The 99th percentile uses z = 2.3263, giving 100 + 2.3263 × 15 = 134.90. The 25th percentile is 100 − 0.6745 × 15 = 89.88. So in this group a score of about 125 beats 95% of people, and about 135 beats 99%. Pick “A percentile” in the calculator, enter 95, and add the mean and standard deviation to get the same figures.
Worked Example 4: What Share Falls Between Two Scores?
Percentiles also answer “how many are in between”. Subtract the lower percentile from the higher one. Suppose a test has a mean of 100 and a standard deviation of 15, and you want the share of people scoring between 85 and 122.5 points.
Step 1. The z-scores are (85 − 100) / 15 = −1.00 and (122.5 − 100) / 15 = 1.50, which are whole-looking values on purpose.
Step 2. The percentiles are 15.87 and 93.32.
Step 3. Subtract: 93.32 − 15.87 = 77.45. About 77% of people score between 85 and 122.5. The middle half of any bell curve lies between the 25th and 75th percentiles, which are z = −0.6745 and 0.6745, so exactly 50% is there by definition.
How Do IQ Scores, T-Scores and Other Standard Scores Relate to Percentiles?
Many reported scores are z-scores in disguise. They rescale z so the numbers look friendlier, with a fixed mean and standard deviation. Once you know the scale, the percentile follows from the z-score.
| Scale | Mean | SD | Score | z-score | Percentile |
|---|---|---|---|---|---|
| IQ | 100 | 15 | 115 | 1.00 | 84.13 |
| T-score | 50 | 10 | 62 | 1.20 | 88.49 |
| Test scaled to 500 and 100 | 500 | 100 | 350 | −1.50 | 6.68 |
To use one of these scales, first convert the score to z with (score − mean) / SD, then convert z to a percentile. For a T-score the formula is easy to reverse: T = 50 + 10 × z, so a T-score of 62 is z = 1.2. These conversions assume the scores are close to normal, which is how most of these scales are built.
How Do Percentiles, Quartiles and Z-Scores Fit Together?
Quartiles are just three special percentiles. The first quartile is the 25th percentile, the median is the 50th and the third quartile is the 75th. In a normal distribution they sit at z = −0.6745, 0 and 0.6745. The distance between the first and third quartile, the interquartile range, is therefore about 1.349 standard deviations.
That gives a quick check on real data. If the interquartile range of your sample is far from 1.349 times its standard deviation, the data are probably not normal and a bell-curve percentile will mislead you. For a feel of how the percentile moves with the z-score, try z = 0.25, which is the 59.87th percentile, and z = −0.25, which is the 40.13th. The two add to 100, as symmetry requires.
What Does a Percentile Actually Mean?
A percentile is a rank, not a score. The 89th percentile means about 89% of the group scored lower. It does not mean you answered 89% of the questions correctly, and a percentile of 50 is average, not a failing mark.
The percentile also says nothing about how large the gap is. Two students at the 98th and 99th percentile may differ by a few points, while two students at the 50th and 51st are separated by far less. Near the middle of a bell curve, one percentile point covers a small slice of score. In the tails, one percentile point can cover a large one. That is why z-scores and percentiles are usually reported together.
When people say “top 10%”, they mean the 90th percentile or above. The calculator shows both views, the share below and the share above, so you can quote whichever your audience expects.
Is a Normal Percentile the Same as a Percentile in Your Data?
Not always. The calculator gives the percentile under a normal model, which assumes your values follow a bell curve. A percentile calculated from the data itself, by sorting the values and counting how many fall below, is an empirical percentile. The two agree when the data really is close to normal and drift apart when it is skewed.
Income, waiting times and counts are often skewed, so a normal percentile can be off by many points. If you have the raw values, sort them and read the quartiles directly with the five-number summary calculator, or check the shape of the data before you trust a bell-curve conversion. If your data are counts of successes out of a fixed number of trials, the binomial distribution calculator gives exact percentiles without a normal approximation.
How Do You Convert a Z-Score to a Percentile in Excel, R, Python and a TI-84?
Every tool has a one-line version. They all return the area to the left, which you multiply by 100.
| Task | Excel / Sheets | R | Python (SciPy) | TI-84 |
|---|---|---|---|---|
| z to percentile | =NORM.S.DIST(z, TRUE)*100 | pnorm(z)*100 | norm.cdf(z)*100 | normalcdf(-1E99, z)*100 |
| Score to percentile | =NORM.DIST(x, mean, sd, TRUE)*100 | pnorm(x, mean, sd)*100 | norm.cdf(x, mean, sd)*100 | normalcdf(-1E99, x, mean, sd)*100 |
| Percentile to z | =NORM.S.INV(p/100) | qnorm(p/100) | norm.ppf(p/100) | invNorm(p/100) |
Excel also has a PERCENTRANK function, but it ranks a value inside a list of data, which is the empirical percentile from the previous section, not the normal one. Use NORM.S.DIST when you want the bell-curve answer.
What Mistakes Do People Make When Converting Z-Scores?
- Reading a percentile as a percentage correct. The 80th percentile is a rank, not a mark of 80%.
- Forgetting the sign. A negative z-score is below the mean, so its percentile is below 50.
- Using the wrong tail. A table that gives the area from 0 to z, not from the left, needs 50 added for a positive z. The z-table page shows how to tell the layouts apart.
- Entering the variance. The standard deviation is the square root of the variance. A variance of 225 means a standard deviation of 15.
- Applying it to non-normal data. The percentile is only as good as the bell-curve assumption. A skewed sample needs an empirical percentile.
- Rounding too early. Round z at the end, not in the middle. A z of 1.625 rounded to 1.63 gives 94.84, while the exact answer is 94.79.
If your distribution is bell-shaped but you want to see its curve with your own mean and spread first, the Gaussian distribution calculator draws it.
How Accurate Is the Conversion for Very Large or Small Z-Scores?
The calculator uses the exact normal CDF, so it stays accurate far into the tails. A z-score of 3.5 gives the 99.9767th percentile, and a z-score of −3.5 gives the 0.0233rd, a little over two hundredths of one percent. For z beyond about 4 the percentile is so close to 0 or 100 that it is better to quote the tail probability, which the result cards also show.
The only approximations come from rounding the displayed numbers. A printed table with four decimals can be off by up to 0.005 of a percentile point, and a calculator that shows six decimals is off by much less. If you need the printed grid for a class or an exam, the z-table can be printed or copied from that page.
Frequently Asked Questions
How do you convert a z-score to a percentile?
Find the area under the standard normal curve to the left of the z-score and multiply it by 100. For z = 1.23 the area is 0.8907, so the percentile is 89.07.
What percentile is a z-score of 1?
A z-score of 1 is at the 84.13th percentile. About 84% of a normal population scores below one standard deviation above the mean.
What percentile is a z-score of 0?
A z-score of 0 is the 50th percentile. It sits exactly at the mean, with half the values below it and half above.
What is the z-score for the 90th percentile?
The z-score for the 90th percentile is 1.2816. With a mean of 100 and a standard deviation of 15, that is a score of 100 + 1.2816 × 15 = 119.22.
Can a z-score give a negative percentile?
No. Percentiles run from 0 to 100. A negative z-score gives a percentile below 50: for z = −1.2 it is 11.51.
What is the difference between a percentile and a percentage?
A percentage is a share of a total, such as 85% of the questions right. A percentile is a rank: the 85th percentile means you scored higher than about 85% of the group.
Does this work for any data?
It works when the data are roughly bell-shaped. For skewed data the normal percentile can differ from the percentile you would get by sorting the values, so check the shape first.
How accurate is this z-score to percentile calculator?
It uses the exact standard normal CDF and agrees with SciPy's norm.cdf to many decimal places, including far in the tails. The decimal places you choose only change how the answer is displayed.
Sources: NIST/SEMATECH e-Handbook of Statistical Methods, section 1.3.6.6.1 Normal Distribution. SciPy documentation, scipy.stats.norm. R documentation, Normal. Microsoft Support, NORM.S.DIST and PERCENTRANK functions.
Related Calculators
These pages cover the table, the reverse direction and areas between any two scores, or browse the full list of free statistics calculators: