


Descriptive vs Inferential Statistics
Descriptive statistics summarize the data you have. Inferential statistics use a sample to say something about a population. Paste a sample and see both answers side by side.
Sample Analyzer: Describe, Then Infer
Enter a sample, pick a confidence level, and compare what the data say with what they imply about the population.
Your data, the mean and the interval for the population mean
Working appears here.Summary appears here.Count, mean, median, spread and range are reported exactly, with no probability attached.
The same values give a standard error, a confidence interval and an optional one-sample t test.
The chart shows why the interval for the mean is far narrower than the spread of the individual values.
What Is the Difference Between Descriptive and Inferential Statistics?
Descriptive statistics summarize the data you actually have. Inferential statistics use a sample to draw conclusions about a larger population you have not fully measured. The first reports what happened in your data. The second estimates what is probably true beyond it, and says how sure it is.
A teacher who averages the marks of her own 30 students is describing. A researcher who tests 30 students and states a range for the average of every student in the country is inferring. The arithmetic can be the same, and the claim is different. That difference in claim is what separates the two.
| Feature | Descriptive | Inferential |
|---|---|---|
| Question answered | What does my data look like? | What is probably true of the population? |
| Data used | The whole data set you have | A sample, treated as a piece of a population |
| Typical outputs | Mean, median, standard deviation, range, charts | Confidence intervals, p-values, test results |
| Uncertainty | None about the data itself | Always some, from sampling error |
| Needs probability | No | Yes |
| Can be wrong because of luck | No, it just reports the numbers | Yes, a different sample gives a different answer |
The tool above shows both sides on one list of numbers. Paste a sample and it gives you the descriptive summary first, then the inferential estimate that comes from the same values.
How Do You Use This Sample Analyzer?
Paste or type your numbers, choose a confidence level, and optionally enter a value to test the mean against. The tool splits the answer into a descriptive part and an inferential part.
- Enter your sample. Separate values with commas, spaces or new lines. You need at least 3 numbers.
- Pick a confidence level. 90%, 95% or 99%. A higher level gives a wider interval.
- Add a hypothesized mean (optional). Leave it empty to skip the test. Enter a number to get a t statistic and a two-sided p-value.
- Read both groups. The descriptive cards describe your sample exactly. The inferential cards estimate the population mean and carry a margin of error.
The quick buttons load the example data used on this page. The chart marks every value, the sample mean, and the confidence interval for the population mean, so you can see that the interval is much narrower than the spread of the data.
What Are Descriptive Statistics?
Descriptive statistics are numbers and charts that summarize a data set: where its center is, how spread out it is, and what shape it has. They describe the data in hand and make no claim about anything outside it.
They fall into three groups. Measures of center, such as the mean and median, say what a typical value looks like. Measures of spread, such as the range, variance and standard deviation, say how much values differ. Measures of shape and position, such as skewness, quartiles and percentiles, say how the values are arranged. Tables, histograms and box plots belong here too.
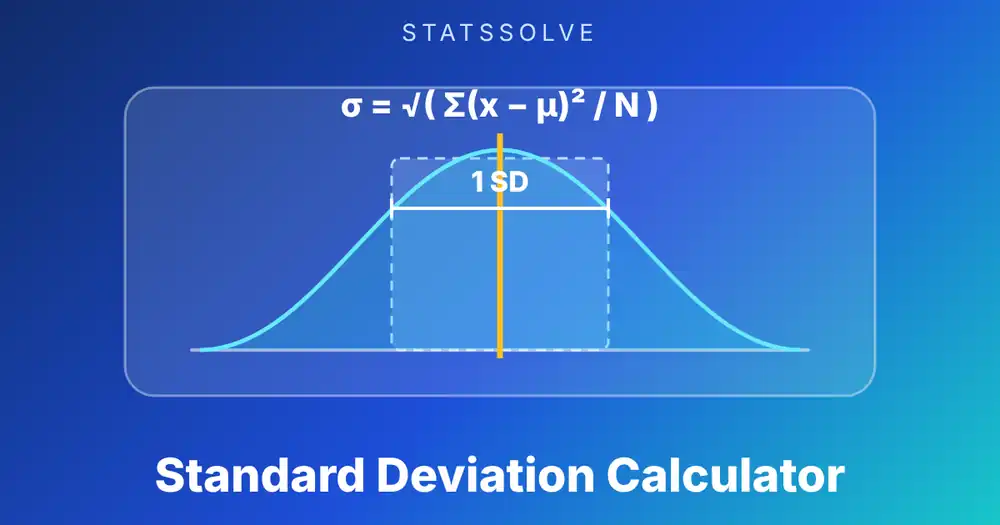
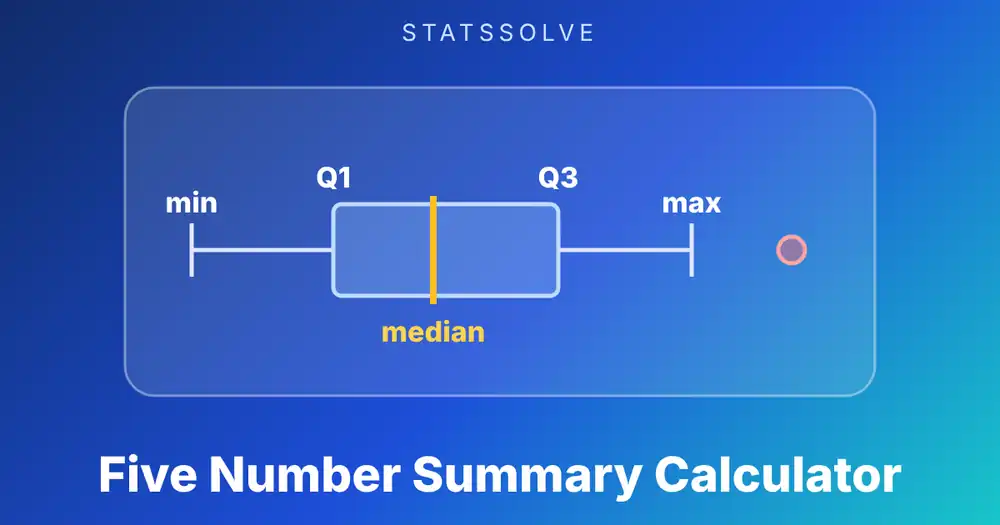
Because descriptive statistics only report the data, they have no margin of error. If 7 of your 12 quiz scores are above 80, then exactly 7 of 12 are, and no probability is involved. To get the numbers for your own list, use the standard deviation calculator for spread and the five number summary calculator for quartiles and outliers.
What Are Inferential Statistics?
Inferential statistics use a sample to estimate or test something about a population. The two main tools are estimation, which gives a confidence interval for an unknown value, and hypothesis testing, which asks whether the data are consistent with a claim.
The reason this works is sampling variability. If you took another sample, you would get another mean. Probability theory tells you how much sample means typically move around, and that is what turns a single sample into a range of plausible population values. The size of the move is the standard error, s / √n for a mean.
Inference only works when the sample represents the population. A random sample gives you valid probability statements. A convenience sample, such as only the customers who answered a survey, can be large and still misleading, because no formula repairs a biased way of choosing people.
What Is the Difference Between a Population and a Sample?
A population is every member of the group you care about. A sample is the part of it you actually measure. A number computed from a population is a parameter, and a number computed from a sample is a statistic.
| Quantity | Population (parameter) | Sample (statistic) |
|---|---|---|
| Mean | μ | x̄ (x-bar) |
| Standard deviation | σ | s |
| Proportion | p | p̂ (p-hat) |
| Size | N | n |
| Value | Fixed but usually unknown | Known, changes from sample to sample |
Inference is the bridge from the right-hand column to the left. You know x̄, s and p̂, and you want to say something about μ, σ and p.
The same list of numbers can be a population or a sample depending on your goal. Five salaries of 48, 52, 55, 61 and 84 thousand dollars are a population if they are every employee of a small firm, and a sample if they are five people picked from a whole industry. The mean of 60 thousand is the same either way. What changes is whether you divide the spread by n (population standard deviation 12.73) or by n − 1 (sample standard deviation 14.23).
Worked Example 1: How Do You Describe 12 Quiz Scores?
Take 12 quiz scores: 72, 85, 90, 68, 77, 95, 81, 88, 74, 79, 83, 91. A full descriptive summary is a handful of numbers.
The mean and median are almost equal, so the scores are close to symmetric. About two thirds of the scores (8 of 12) fall within one standard deviation of the mean, between 73.6 and 90.2. That is the whole description. Nothing here says anything about students who did not take this quiz. Press the first quick button above to load these values.
Worked Example 2: How Do You Infer the Class Average From the Same Scores?
Now treat the 12 scores as a random sample from a much larger group, such as all students who might take this quiz. The sample mean of 81.92 is your best single guess for the population mean, but it is only a guess. A 95% confidence interval turns it into a range.
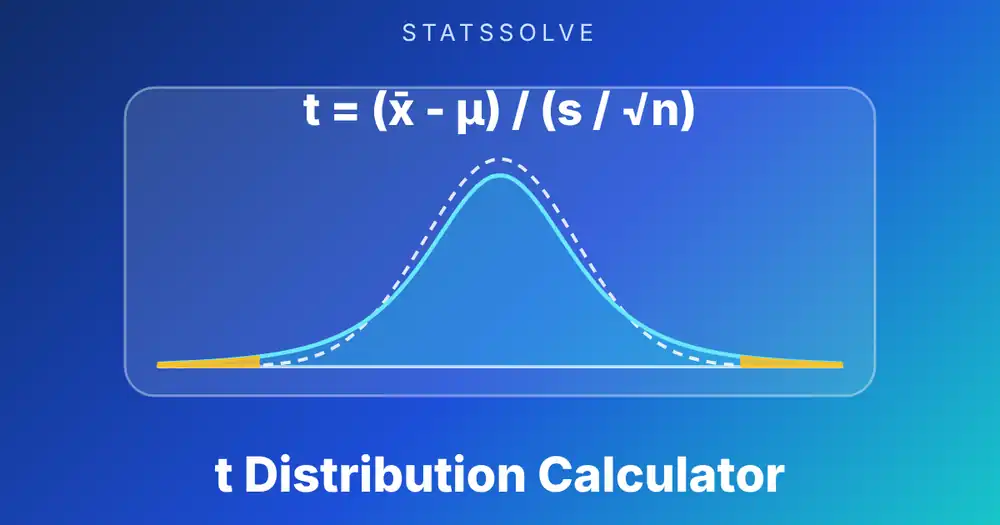
The honest statement is: we estimate the population mean is between 76.7 and 87.2. The uncertainty is the part descriptive statistics never had. The t value is used rather than 1.96 because s is estimated from only 12 values; the t distribution calculator gives the critical value for any confidence level and degrees of freedom.
Other confidence levels on the same data give 77.62 to 86.21 at 90% and 74.49 to 89.34 at 99%. Higher confidence costs you a wider interval. A 95% interval does not mean there is a 95% chance this particular interval contains the mean. It means the method captures the true mean in about 95% of repeated samples, and a simulation of 100,000 samples of 12 from a normal population confirms it: the intervals caught the true mean 95.0% of the time.
Worked Example 3: Is the Class Average Different From 75?
A one-sample t test asks whether the data are consistent with a claimed mean. Suppose the pass benchmark is 75 and you want to know if this class differs from it.
A p-value of 0.0146 means that if the true mean really were 75, a sample this far from 75 would turn up about 1.5% of the time. That is rare enough to doubt the claim, so at the usual 5% level you would say the class mean differs from 75. Notice that 75 sits outside the 95% interval of 76.65 to 87.18, which is the same conclusion seen another way.
Change the benchmark to 80 and the picture flips. Now t = 0.801 and p = 0.440, and 80 sits well inside the interval. The data say nothing against a true mean of 80. Failing to reject is not proof that the mean is 80. It only means this sample cannot tell 80 from 81.92.
Worked Example 4: What Does a Poll Result Really Tell You?
A poll asks 1,000 people and 520 say yes. Descriptively, 52% of the people asked said yes. That statement is complete and true. Inference starts when someone says “52% of all voters support it”.
The interval includes 50%, so the poll cannot show that a majority supports the idea. Testing p = 0.5 gives z = 1.265 and a two-sided p-value of 0.206, which agrees. Newspapers that report “52% vs 48%” as a lead are reporting the descriptive result and skipping the inference.
For exact binomial probabilities with a known success rate, the binomial probability calculator is the right tool. The normal approximation used here is fine at n = 1,000 and not at n = 15.
Why Does Sample Size Matter for Inference but Not for Description?
Description just reports whatever you have, so a sample of 5 and a sample of 5,000 are both described exactly. Inference gets sharper as the sample grows, because the standard error shrinks with √n. Four times the data halves the margin of error.
| Sample size n | t critical (95%) | Margin of error, mean (s = 10) | Margin of error, poll (p = 0.5) |
|---|---|---|---|
| 10 | 2.262 | ± 7.15 | n/a |
| 30 | 2.045 | ± 3.73 | n/a |
| 100 | 1.984 | ± 1.98 | ± 9.8 points |
| 400 | 1.966 | ± 0.98 | ± 4.9 points |
| 1,000 | 1.962 | ± 0.62 | ± 3.1 points |
| 4,000 | 1.961 | ± 0.31 | ± 1.5 points |
Going from 100 to 400 people cuts the margin of error in half, from about 9.8 to 4.9 points. Going from 1,000 to 4,000 cuts it from 3.1 to 1.5, for four times the cost. That is why professional polls settle near 1,000 respondents. Sample size cannot fix bias, though. A huge sample drawn the wrong way still gives a confidently wrong answer.
How Do You Decide Which One You Need?
Ask what the sentence you want to write says. If it only mentions the data you collected, you need descriptive statistics. If it mentions a larger group, a future outcome, or a difference you want to claim is real, you need inferential statistics.
- “The average order in this file is $42.” Descriptive. It reports the file.
- “Customers spend about $42 per order.” Inferential. It talks about customers in general.
- “Group A scored 5 points higher than group B.” Descriptive, as a report on these two groups.
- “Group A really does score higher than group B.” Inferential. It needs a test.
- “Sales rose 8% last quarter.” Descriptive, if you have all the sales.
- “Sales will rise 8% next quarter.” Inferential or forecasting, with uncertainty.
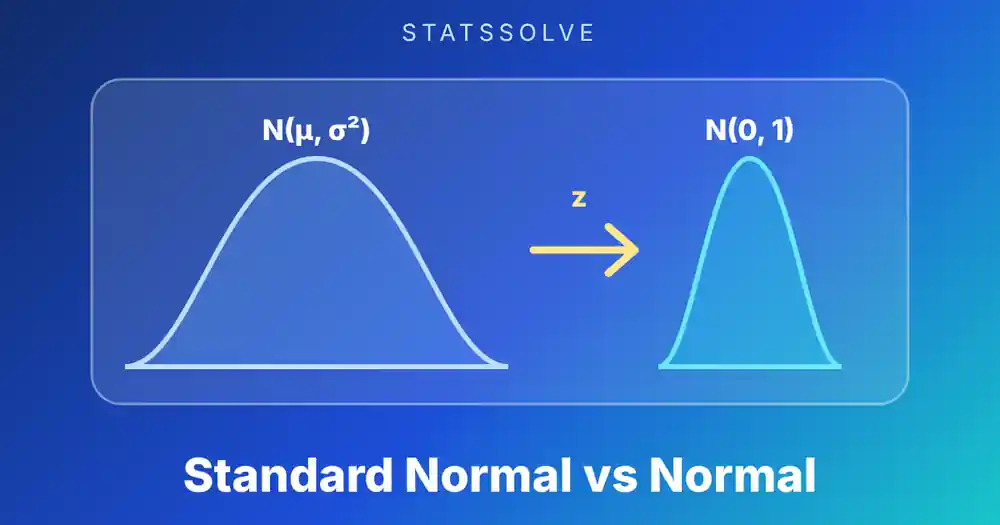
In practice you almost always do both. You describe first, to check for typos, outliers and skew, and then infer. Looking at a histogram before running a test also tells you whether the assumptions are plausible. The standard normal vs normal distribution guide covers the z-scores that many of those tests rely on.
Can You Use Inferential Statistics on a Whole Population?
If you have every member of the population, you do not need to estimate its mean, because you can calculate it. A confidence interval around a number you already know exactly has nothing to say. Some statisticians therefore advise using description only when the data are complete.
There is a real disagreement here. Others argue that a complete data set can still be treated as one draw from a process that could have produced different values, so tests remain meaningful. For example, last year’s sales for every store are the full record, but you may want to know whether a difference between two regions would happen again next year. The practical rule is to be clear about what you are claiming: a statement about this exact data set is descriptive, a statement about the process behind it is inferential, and you should say which.
What Mistakes Do People Make With Descriptive and Inferential Statistics?
- Reporting a sample statistic as a population fact. “The average is 81.9” is fine. “Every student averages 81.9” is not. Give the interval.
- Using n instead of n − 1. For a sample, divide the squared deviations by n − 1. Dividing by n understates the spread, here 7.93 instead of 8.28.
- Treating a non-random sample as random. Survey volunteers, online reviews and people who stay on a website are self-selected. Inference from them has no guarantee.
- Misreading a confidence interval. It is about the population mean, not about where 95% of individual values fall. Here the interval is 76.7 to 87.2, yet individual scores run from 68 to 95.
- Treating “not significant” as “no difference”. A p-value of 0.44 means the sample could not detect a gap, not that none exists.
- Using the mean on skewed data. A few large values pull the mean up. Report the median, or look at the five number summary, before doing anything else.
Which Methods and Software Functions Belong to Each Type?
Descriptive methods work on one data set and need no probability model. Inferential methods need an assumption about how the sample was drawn, and usually a distribution such as the normal or t.
| Type | Method | Excel / Sheets | R | Python |
|---|---|---|---|---|
| Descriptive | Mean | =AVERAGE(A1:A12) | mean(x) | np.mean(x) |
| Descriptive | Median | =MEDIAN(A1:A12) | median(x) | np.median(x) |
| Descriptive | Sample SD | =STDEV.S(A1:A12) | sd(x) | np.std(x, ddof=1) |
| Inferential | t critical value | =T.INV.2T(0.05, 11) | qt(0.975, 11) | stats.t.ppf(0.975, 11) |
| Inferential | One-sample t test | =T.TEST (two-sample form) | t.test(x, mu = 75) | stats.ttest_1samp(x, 75) |
All of these use the 12 scores from Example 1, so you can compare your output with the numbers in this guide: mean 81.92, s 8.28, t critical 2.201, and t = 2.892 against 75. Excel has no one-line one-sample t test, so many people compute t from the standard error and then use T.DIST.2T. For other methods such as regression, ANOVA and chi-square tests, the starting point is still a descriptive look at the data.
Where Do Descriptive and Inferential Statistics Appear in Real Work?
Descriptive statistics appear wherever data are reported: a dashboard of monthly sales, a hospital summary of patient ages, a school report of average marks. Inferential statistics appear wherever a decision depends on something not directly observed.
In medicine, a trial of a few hundred patients is used to estimate how a treatment would work for everyone with the condition. In manufacturing, a sample of 50 parts decides whether a whole batch is accepted. In marketing, an A/B test on a slice of visitors decides which page design goes live. In each case a descriptive table opens the analysis, and a confidence interval or test closes it. Reports that skip the second step often overstate what the data show, and reports that skip the first often miss data errors.
What Should You Remember About Descriptive vs Inferential Statistics?
- Descriptive statistics summarize the data you have. Inferential statistics use a sample to draw conclusions about a population.
- Parameters (μ, σ, p) describe populations. Statistics (x̄, s, p̂) describe samples and estimate them.
- Descriptive results are exact. Inferential results carry a margin of error and depend on how the sample was chosen.
- A 95% confidence interval for the mean is x̄ ± t × s / √n. Four times the sample halves its width.
- A p-value tells you how surprising the data would be if a claim were true. It does not prove the claim.
- Describe first, then infer. Plots and summaries catch errors that tests cannot.
Frequently Asked Questions
What is the main difference between descriptive and inferential statistics?
Descriptive statistics summarize the data you have, such as its mean and spread. Inferential statistics use a sample to estimate or test something about a larger population. The first has no uncertainty about the data, and the second always carries a margin of error.
Is the mean descriptive or inferential?
Both. A sample mean is a descriptive statistic of that sample. Once you use it to estimate the population mean and attach a confidence interval, it is part of an inference. The calculation is the same, and the claim you make about it decides.
Is standard deviation descriptive or inferential?
Standard deviation is a descriptive measure of spread. It becomes part of inference when it is used to compute a standard error, a confidence interval or a test statistic, as in s / √n.
Is a confidence interval descriptive?
No. A confidence interval is inferential, because it makes a statement about a population value you did not observe. For the 12 quiz scores, the mean of 81.92 is descriptive and the interval 76.65 to 87.18 for the population mean is inferential.
Do I need a random sample for inferential statistics?
Yes, or something close to it. Random selection is what justifies the probability statements in a confidence interval or p-value. A biased sample, such as self-selected survey respondents, can give a precise-looking but wrong result.
Why does descriptive statistics use n and inferential use n − 1?
When you describe a complete population, you divide the squared deviations by n. When you estimate the population spread from a sample, you divide by n − 1, because the sample mean is closer to the sample values than the true mean is. For the five salaries in this guide that gives 12.73 against 14.23.
Which comes first, descriptive or inferential statistics?
Descriptive comes first. You summarize and plot the data to check for errors, outliers and skew, and then choose an inferential method that fits what you see. Most analyses use both.
Sources: NIST/SEMATECH e-Handbook of Statistical Methods, section 1.3.5.2 (confidence limits for the mean); SciPy documentation, scipy.stats.ttest_1samp and scipy.stats.t; R documentation, t.test; Microsoft Support, T.INV.2T and STDEV.S functions.
Related Calculators
Ready to run your own numbers? These do the next step, or browse the full list of free statistics calculators: