


Quartile Calculator
Paste your numbers and get Q1, Q2 and Q3 with the interquartile range, then see where every value falls. Choose the quartile method your textbook, TI-84 or Excel uses, and check any single value against the four quarters.
Quartile and IQR Calculator
Enter your data separated by commas, spaces or new lines. Results update as you type.
| Quarter | Values lie | Count |
|---|
| Method | Q1 | Median | Q3 | IQR |
|---|
Working appears here.| # | Value | Quarter | Flag |
|---|
Syntax appears here.Summary appears here.See Q1 and Q3 under the TI-84, Tukey and both Excel rules together, so you know which answer your class expects.
Quartile deviation, midhinge, Bowley skewness and the quartile coefficient of dispersion come out alongside Q1 and Q3.
Type one number to see its quarter, its percentile rank in your data and whether it counts as an outlier.
What Does a Quartile Calculator Do?
A quartile calculator splits a list of numbers into four equal-sized groups and reports the three cut points between them: Q1, Q2 (the median) and Q3. It also gives the interquartile range, IQR = Q3 − Q1, which is the width of the middle half of your data.
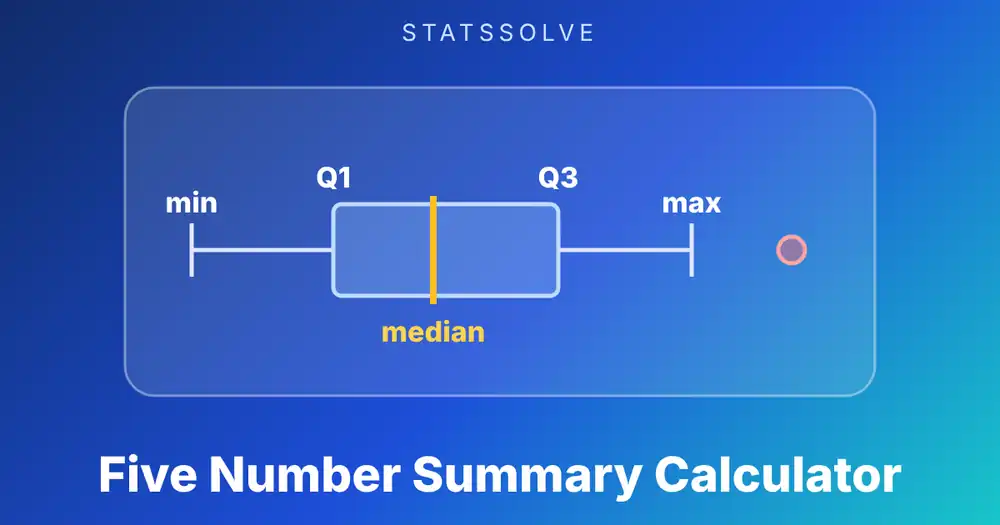
Paste a column of numbers into the box above and you get those figures straight away, along with the things people usually need next: the outlier fences, a quartile coefficient of dispersion, a skewness check, and a plot that colours every value by the quarter it falls in. If you want the picture, the box plot maker draws it. If you only need the five summary numbers for a box plot, use the five number summary calculator; this page focuses on the quartiles and the spread measures built from them.
There is one catch worth knowing before you trust any answer. Statisticians never agreed on a single way to compute quartiles, so a textbook, a TI-84 and Excel can return three different values for the same data. The calculator lets you pick the method and shows all four side by side, so you can match whichever one your course or software uses.
How Do You Use This Quartile and IQR Calculator?
Type or paste your numbers, choose a quartile method, and read the results. Everything updates as you type.
- Enter the data. Separate values with commas, spaces, semicolons or new lines. Up to 500 values work, and negatives and decimals are fine.
- Pick the method. The default is the median-of-halves rule taught in most intro courses and used by the TI-84. Choose the Excel options if you are checking a spreadsheet, or Tukey hinges if your textbook includes the median in both halves.
- Check a single value (optional). Type a number into the "Which quarter is this value in?" box and the calculator tells you the quarter, its percentile rank within your data, and whether it is an outlier.
- Read the output. You get Q1, Q2, Q3, the IQR, three more spread measures, both sets of outlier fences, step-by-step working and the matching Excel, R, Python and TI-84 commands.
The strip chart below the cards plots every value as a dot, shades the four quarters and marks Q1, Q2 and Q3, so you can see at a glance whether the quarters are evenly spread or bunched up on one side.
What Are Quartiles?
Quartiles are the three values that divide a sorted data set into four parts, each holding about a quarter of the observations. Q1 is the first (lower) quartile, Q2 is the second quartile and equals the median, and Q3 is the third (upper) quartile.
In percentile language, Q1 is the 25th percentile, Q2 the 50th and Q3 the 75th. About 25% of the values sit at or below Q1, half sit at or below Q2, and 75% sit at or below Q3. The four groups they create are sometimes called quarters. The first quarter is everything up to Q1, the second runs from Q1 to the median, the third from the median to Q3, and the fourth is everything above Q3.
Notice that the quartiles are positions in the ordered data, not averages. That is why they ignore how extreme the largest and smallest values are. A single wild number at the top of the list changes the maximum, the mean and the standard deviation, but it barely moves Q1 or Q3. That resistance to extremes is why quartiles are used for skewed data such as incomes and house prices. For ordinary averages, the mean, median and mode calculator sits alongside this one.
How Do You Find Q1, Q2 and Q3 by Hand?
For an even number of values, split the sorted list in half. Q2 is the median of the whole list, Q1 is the median of the lower half and Q3 is the median of the upper half.
Here are ten quiz scores out of 100, already sorted: 52, 58, 61, 64, 67, 70, 73, 75, 82, 90.
So the middle half of the class scored between 61 and 75, and the spread of that middle half is 14 points. The lowest score (52) and highest (90) did not enter the quartile calculation at all, which is exactly the point.
How Do You Find Q3 When the Median Is One of the Data Points?
When n is odd, the median is an actual value in the list, and you have to decide whether it belongs to the lower half, the upper half, both, or neither. Two conventions are in common use, and they give different quartiles.
Take nine values: 3, 5, 7, 8, 9, 11, 13, 15, 17. The median is the fifth value, 9.
Both are legitimate; they just answer slightly different questions. The excluded version treats the median as a separator that belongs to neither half. The included version, which John Tukey used for his hinges, keeps it in both. If you are asked how to find Q3 in a homework problem, look for the rule your textbook states and follow it. When the problem says nothing, the median-excluded rule is the safer default for most US courses.
With an even n there is no such ambiguity, because the median is not a data point and both conventions split the list in exactly the same place.
Why Do Different Quartile Methods Give Different Answers?
Methods differ because a small sample rarely divides cleanly into quarters. Each method makes a different choice about what to do with the leftover fraction of a position, and that choice shifts Q1 and Q3 slightly.
There are two families. The halves methods take medians of the lower and upper halves. The position methods, used by Excel, R and NumPy, work out where a quartile sits in the ordered list and interpolate between the two nearest values. The two Excel versions differ in the position formula:
Apply them to the ten quiz scores. Q1 sits at position 1 + 0.25 × 9 = 3.25 under the inclusive rule, a quarter of the way from the 61 to the 64, which gives 61.75. Under the exclusive rule it sits at 0.25 × 11 = 2.75, three quarters of the way from 58 to 61, which gives 60.25. The results for all four methods:
| Method (10 quiz scores) | Q1 | Q2 | Q3 | IQR |
|---|---|---|---|---|
| Median of halves, median excluded | 61 | 68.5 | 75 | 14 |
| Median of halves, median included (Tukey) | 61 | 68.5 | 75 | 14 |
| Excel QUARTILE.INC (R type 7) | 61.75 | 68.5 | 74.5 | 12.75 |
| Excel QUARTILE.EXC (R type 6) | 60.25 | 68.5 | 76.75 | 16.5 |
The IQR ranges from 12.75 to 16.5 for the very same ten numbers. None of these is wrong. As the sample grows, the gap between methods shrinks, because the leftover fraction of a position matters less and less.
Use the method your course or software specifies, state it when you report a result, and never mix methods inside one analysis.
What Is the Interquartile Range and How Do You Calculate It?
The interquartile range is the distance between the third and first quartiles: IQR = Q3 − Q1. It measures how spread out the middle 50% of the data is.
Unlike the ordinary range, max − min, which depends on the two most extreme values, the IQR ignores the bottom and top quarters entirely.
A small demonstration makes this concrete. Eleven weekly grocery bills in dollars: 38, 42, 45, 47, 51, 55, 58, 62, 66, 71 and 130. With the median-excluded rule, Q1 = 45 and Q3 = 66, so the IQR is 21. Now remove the 130:
| Measure | With the $130 bill | Without it |
|---|---|---|
| Range | 92 | 33 |
| Standard deviation (sample) | 25.24 | 10.80 |
| IQR (median excluded) | 21 | 17 |
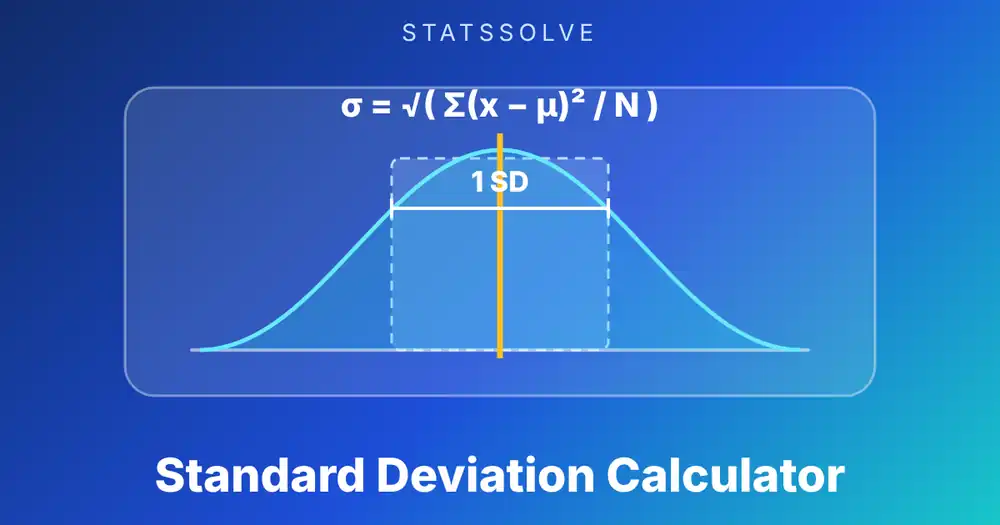
One value pushed the range up almost threefold and the standard deviation up by a factor of 2.3, while the IQR moved from 17 to 21. That stability is why the IQR is the preferred spread measure for skewed data such as incomes, waiting times and prices. When the data are close to bell-shaped, the standard deviation calculator and the IQR tell a consistent story: for a normal distribution, IQR = 1.349 × σ, so an IQR of 13.49 points to a standard deviation near 10.
How Do You Find Outliers With the IQR Rule?
Compute the fences Q1 − 1.5 × IQR and Q3 + 1.5 × IQR. Any value below the lower fence or above the upper fence is flagged as an outlier by Tukey's rule.
For the grocery bills above (Q1 = 45, Q3 = 66, IQR = 21):
The $130 bill sits above 97.5, so it is an outlier. Every other bill lies between 13.5 and 97.5 and is not. The fences depend on the quartile method: with Tukey hinges the upper fence drops to 91. The conclusion is the same here, but a value close to a fence can switch sides.
Tukey also defined a second, wider pair of fences at 3 × IQR. Values between the 1.5 and 3 fences are sometimes called mild outliers, and values beyond the 3 fences are extreme outliers. Take twelve measurements: 22, 25, 27, 28, 30, 31, 33, 34, 36, 38, 52, 80. Here Q1 = 27.5, Q3 = 37 and IQR = 9.5, so the 1.5 fences are 13.25 and 51.25 and the 3 fences are −1 and 65.5. The value 52 is a mild outlier because it clears 51.25 but not 65.5, and 80 is an extreme outlier. The calculator reports both counts.
A flag is a prompt to look, not a verdict to delete. It can be a typing error, a value from a different population, or a real and interesting observation. In a perfectly normal sample about 0.7% of values land outside the 1.5 fences by chance. Check the source before you remove anything. The strip chart maker is a good way to look at flagged points next to the rest of the data.
What Are the Quartile Deviation, Midhinge and Quartile Coefficient of Dispersion?
These three figures are all built from Q1 and Q3, and each answers a different question about the middle of the data.
- Quartile deviation (semi-interquartile range) is half the IQR, (Q3 − Q1) / 2. It is a typical distance from the median to a quartile. For normally distributed data it equals 0.6745 σ.
- Midhinge is the average of the two quartiles, (Q1 + Q3) / 2, a robust measure of the center.
- Quartile coefficient of dispersion is (Q3 − Q1) / (Q3 + Q1). It is a unitless measure of relative spread, so it lets you compare data sets measured on different scales. It only makes sense for data that are positive.
Here is the coefficient in use. Two groups of eight salaries (in thousands): group A is 41, 43, 45, 48, 50, 52, 55, 58 and group B is 28, 35, 42, 50, 61, 75, 90, 140. With median-excluded quartiles, group A has Q1 = 44 and Q3 = 53.5, so its coefficient is 9.5 / 97.5 = 0.097. Group B has Q1 = 38.5 and Q3 = 82.5, giving 44 / 121 = 0.364. Group B's middle half is far more spread out relative to its level, and the coefficient says so in a single number. It is the quartile-based cousin of the percentage you get from the coefficient of variation calculator, which is built on the standard deviation and mean instead.
The quartiles also give a quick skewness check, Bowley's coefficient: (Q3 + Q1 − 2 × Q2) / (Q3 − Q1). It runs from −1 to +1. A positive value means the median sits closer to Q1, so the upper part of the box is stretched, a sign of right skew. For group B above, the value is +0.23, while for group A it is −0.05, essentially symmetric.
Which Quartile Does a Value Belong To?
Compare the value with the three cut points. At or below Q1 it is in the first quarter, above Q1 and up to the median it is in the second, above the median and up to Q3 it is in the third, and above Q3 it is in the fourth.
For the quiz scores, Q1 = 61, Q2 = 68.5 and Q3 = 75. A score of 70 is above 68.5 and below 75, so it is in the third quarter. Its percentile rank is a separate calculation: five scores are lower than 70, one equals it, and the usual convention counts half of the ties, so (5 + 0.5) / 10 = 55%.
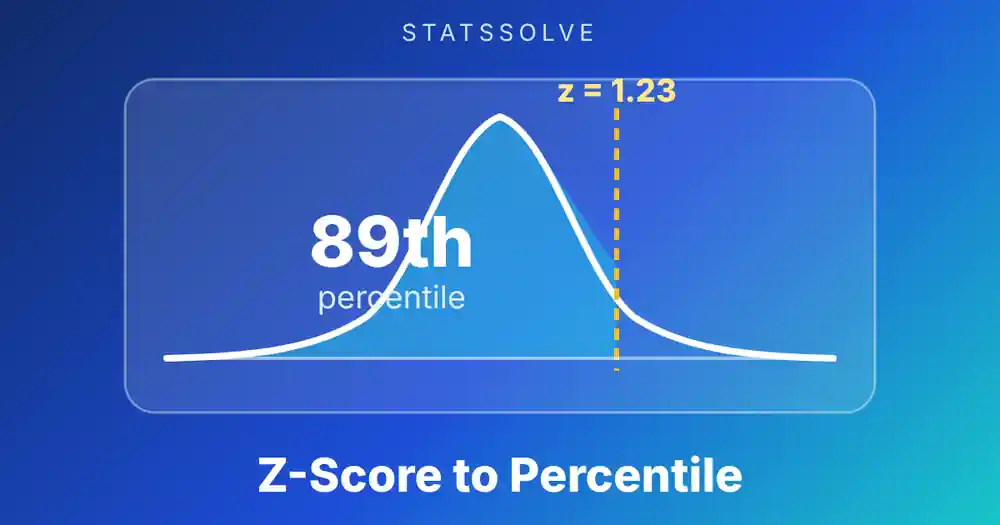
If your data are roughly bell-shaped and you only know the mean and standard deviation, you can work out percentiles with a model instead. Convert the value to a z-score and use the z-score to percentile calculator, which reads the same percentile off the normal curve. The inverse normal distribution calculator goes the other way and finds the score that cuts off a chosen percentile, such as the theoretical Q3 for a normal distribution with a given mean and standard deviation. Both rely on the standard normal areas that the z-table lists.
How Do You Calculate Quartiles in Excel, Google Sheets, R, Python and a TI-84?
Each tool has one default method, so first decide which family you want to match.
| Tool | Command | Method |
|---|---|---|
| Excel, Google Sheets | =QUARTILE.INC(A2:A11, 1) | Inclusive, position 1 + p(n − 1) |
| Excel, Google Sheets | =QUARTILE.EXC(A2:A11, 3) | Exclusive, position p(n + 1) |
| R | quantile(x, c(.25, .5, .75), type = 7) | Type 7 (default), same as INC |
| R | IQR(x, type = 6) | Type 6, same as EXC |
| Python (NumPy) | np.percentile(x, [25, 50, 75]) | Linear (default), same as INC |
| Python (NumPy) | np.percentile(x, 75, method="weibull") | Same as EXC |
| Python (SciPy) | scipy.stats.iqr(x) | Linear (default) |
| TI-83 / TI-84 | STAT → CALC → 1-Var Stats | Median of halves, median excluded |
Python's built-in statistics.quantiles uses the exclusive method by default and the inclusive one if you pass method="inclusive", which trips up many people who expect it to match NumPy. For the ten quiz scores, QUARTILE.INC returns 61.75 and 74.5, QUARTILE.EXC returns 60.25 and 76.75, and the TI-84 returns 61 and 75. The calculator prints the right command with your own numbers filled in, so you can copy it straight into your own sheet or script.
How Does the IQR Compare With the Standard Deviation, MAD and Range?
Each spread measure uses a different part of the data, so each reacts differently to extremes.
- Range uses only the minimum and maximum. It is the most sensitive to outliers and says nothing about the values in between.
- IQR uses the quartiles and ignores the outer quarters. It is resistant to outliers, but it also ignores everything outside the middle half.
- Standard deviation uses every value, squared. It is the natural partner of the mean and the right choice for roughly normal data, but a single outlier can dominate it. See the standard deviation calculator and the variance calculator for the details.
- Mean absolute deviation uses every value without squaring, which makes it gentler on large deviations. The mean absolute deviation calculator also reports the median absolute deviation, the most robust option of all.
A practical rule: pair the mean with the standard deviation, and the median with the IQR.
What Mistakes Do People Make With Quartiles?
Most wrong answers come from a short list of habits.
- Not sorting first. Quartiles are positions in ordered data. Taking the median of the first half of an unsorted list gives nonsense.
- Using the wrong method for the course. If your answer is 61.75 and the key says 61, check whether the problem expects the median-of-halves rule.
- Applying the 1.5 × IQR rule blindly. The rule is a screening tool. In very small samples, or in data that are naturally skewed like incomes, it flags legitimate values.
- Using the quartile coefficient of dispersion on data with zero or negative values. Q3 + Q1 can be near zero, and the ratio becomes meaningless.
Key Points to Remember
- Q1, Q2 and Q3 are the 25th, 50th and 75th percentiles. Q2 is the median.
- IQR = Q3 − Q1 measures the spread of the middle half of the data and resists outliers.
- Different textbooks and programs use different quartile methods. Always state which one you used.
- Outlier fences are Q1 − 1.5 × IQR and Q3 + 1.5 × IQR. The wider fences at 3 × IQR separate extreme outliers.
- For normally distributed data, IQR ≈ 1.349 σ and the quartile deviation ≈ 0.6745 σ.
Frequently Asked Questions
What is the interquartile range?
The interquartile range (IQR) is the difference between the third quartile and the first quartile, Q3 − Q1. It tells you how wide the middle 50% of your data is, and unlike the ordinary range it is not affected by extreme values.
How do you find Q3?
Sort the data, find the median, then take the median of the upper half of the list. With an odd number of values, decide whether the median belongs to the halves: the TI-84 and many textbooks leave it out, while Tukey hinges keep it in. Excel's QUARTILE.INC and QUARTILE.EXC instead interpolate at a calculated position.
Is Q2 the same as the median?
Yes. The second quartile splits the data into a lower and an upper half, which is the definition of the median. All the quartile methods on this page return the same Q2 for a given data set.
Why does Excel give a different quartile than my textbook?
Excel's QUARTILE and QUARTILE.INC place the quartile at position 1 + p × (n − 1) and interpolate. Many textbooks take the median of each half instead. For ten values from 52 to 90, Excel gives Q1 = 61.75 while the median-of-halves rule gives 61. Both are accepted methods, so match the one your course specifies.
Can the IQR be zero or negative?
It cannot be negative, because Q3 is never smaller than Q1. It is zero when the values around the middle of the sorted list are all the same, so that Q1 and Q3 coincide. In that case the 1.5 × IQR fences collapse onto the quartiles and any different value is flagged as an outlier.
What is the IQR of a normal distribution?
For a normal distribution the IQR equals about 1.349 times the standard deviation, and the quartiles sit 0.6745 standard deviations either side of the mean. If a data set's IQR is much larger or smaller than 1.349 times its standard deviation, the data are probably heavier-tailed or lighter-tailed than normal.
Sources: NIST/SEMATECH e-Handbook of Statistical Methods, sections 1.3.5.6 (measures of scale) and 1.3.3.7 (box plot); Tukey, J. W. (1977), Exploratory Data Analysis, Addison-Wesley; Hyndman, R. J. and Fan, Y. (1996), "Sample quantiles in statistical packages", The American Statistician 50(4), 361-365; NumPy documentation for numpy.percentile; SciPy documentation for scipy.stats.iqr; R documentation for quantile.
Related Calculators
Want to look at your data another way? Try these, or browse the full list of free statistics calculators: